Evaluation Dashboard
Accessing the Evaluation Dashboard
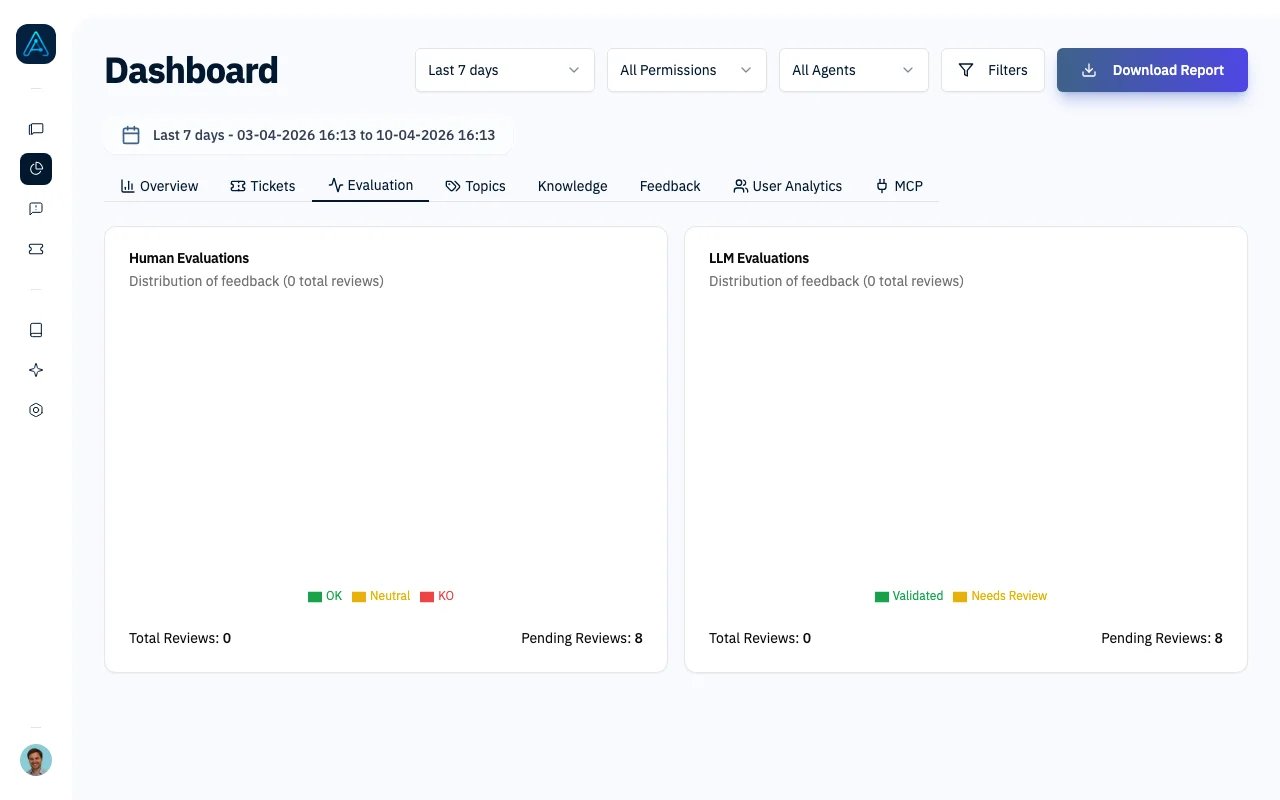
Navigate to Dashboard in the sidebar and select the Evaluation tab.You need Admin, Account Manager, or Viewer permissions to access the Evaluation Dashboard.
Dashboard Sections
The Evaluation tab displays up to six sections, depending on the data available for your filters.Human Evaluations
A pie chart showing the distribution of manual evaluations (OK, KO, Neutral). These are the ratings that admins assign when reviewing conversations in the Conversation Management sidebar.LLM Evaluations
A pie chart showing the distribution of automated evaluations (Validated, Needs Review). The Thread Evaluator generates these ratings based on dimension scores and minimum thresholds.CX Score
Appears when at least one conversation matching your filters has a CX Score. Includes:
Click a score range in the distribution chart to jump to Chat History filtered by that score range and the selected dates.
See CX Score for details on how the score is calculated and how to interpret each dimension.
CX Score Trend
A line chart showing the daily average CX Score over the selected period. Use this to:- Confirm that changes to agent instructions or knowledge base improve quality
- Spot dips that may correlate with knowledge base updates or new topics
CX Score by Agent
A bar chart comparing average CX Score across agents. Helps you identify which agents need attention and which can serve as models for others.Satisfaction
Appears when conversations matching your filters have satisfaction requests, including requests awaiting a response. Includes:Satisfaction feedback is configured per agent. Previously collected requests remain visible even if you disable satisfaction feedback.
Filtering Options
The Evaluation tab shares the same header filters as other dashboard tabs:Related Features
- CX Score - Scoring methodology and dimension details
- Thread Evaluator - Configure automated evaluation
- Conversation Management - Manually evaluate conversations
- Performance Dashboard - Overview of all dashboard tabs
- Diagnose Quality Issues - Investigate low CX Scores step by step