
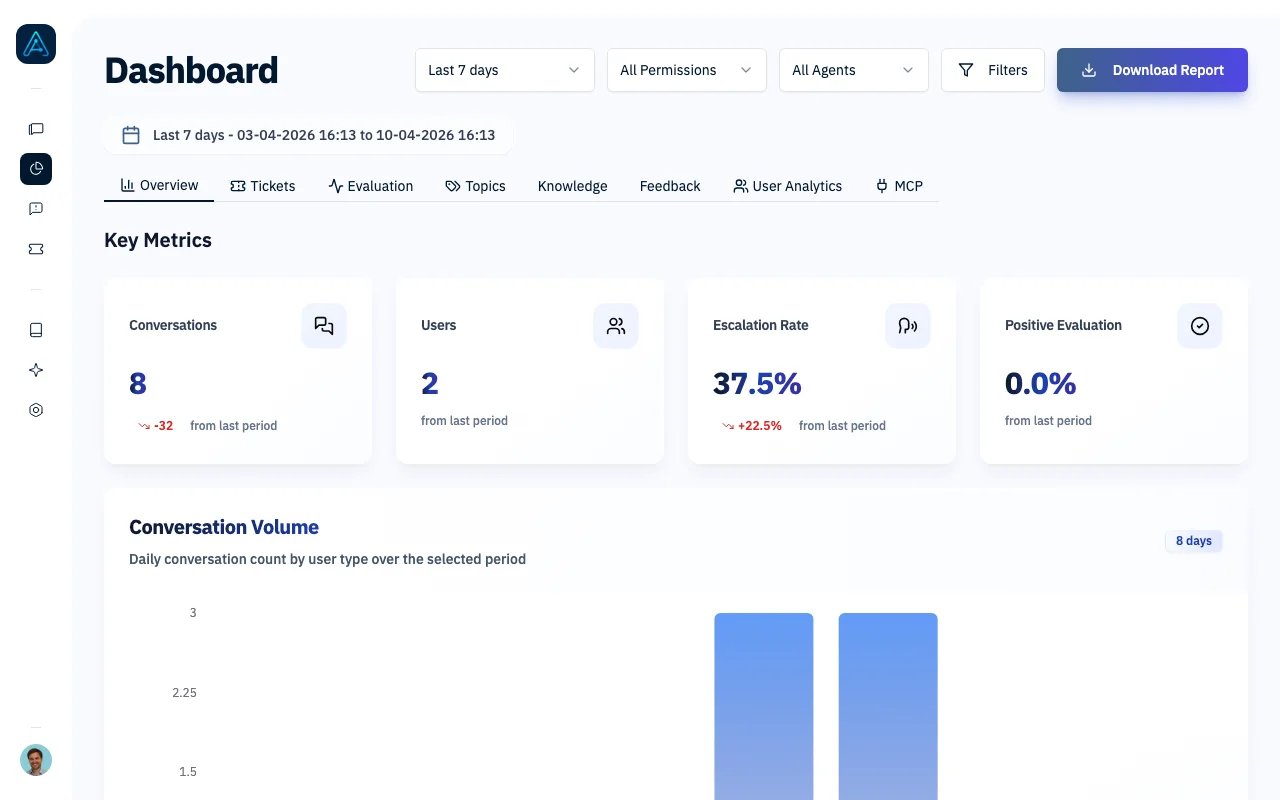
Performance Dashboard
Accessing the Performance Dashboard
Navigate to Dashboard in the sidebar. The Overview tab is displayed by default.You need Admin, Account Manager, or Viewer permissions to access the Performance Dashboard.
Key Performance Metrics
The dashboard displays four primary metrics at the top, each showing the current value and change from the previous period:Dashboard Components
Conversation Volume Chart
A bar chart showing the daily number of conversations over the selected time period. Use this to:- Identify peak usage days
- Spot unusual spikes or drops in activity
- Understand weekly patterns
Distribution Charts
Distribution by User Type
A pie chart showing the users who had at least one conversation in the period, broken down by user permission level. Each user counts once, so the total matches the Users metric. This helps you understand:- Which user segments use the agent
- Whether certain user types are under-represented
- How to prioritize improvements for specific audiences
Distribution by Agent
One bar per agent showing how many conversations it took part in, and what share of all conversations in the period that represents. This reveals:- Which agents handle the most traffic
- Load balancing across agents
- Opportunities to redirect traffic
A conversation can involve several agents and counts for each of them, so the percentages can add up to more than 100%.
Advanced Metrics
Below the main charts, the dashboard shows two additional metrics:Understanding Advanced Metrics
Average Messages per Thread reveals conversation complexity:- Lower values (1-3): Quick, efficient resolutions
- Higher values (5+): Complex issues or potential agent struggles
- Sudden increases may indicate problems with response quality
- Higher rates mean more conversations contain exactly one user message; this does not confirm that the user received a useful answer
- Lower rates may indicate complex topics or knowledge gaps
- Compare against the thread to ticket rate for a complete picture
Filtering Options
Use the dashboard header filters to customize your view:
The Agent filter includes conversations involving any selected agent. A conversation involving several selected agents counts once in conversation totals. Clear the selection to include all agents. The selection is saved when you leave the dashboard and applies to Knowledge card exports.
Period Comparison
All metrics include period-over-period comparison:- Last 7 days compares to the 7 days before
- Last 30 days compares to the 30 days before
- Custom range compares to an equal period immediately prior
- Green with arrow up: Positive trend (or negative for metrics where lower is better)
- Red with arrow down: Negative trend
- No change badge: The metric is unchanged
Best Practices
- Check daily: A quick look at the Overview tab helps catch issues early
- Monitor the thread to ticket rate: Review conversations linked to tickets to understand which issues require support
- Track user volume: Compare the number of users across periods to monitor engagement
- Investigate anomalies: Sudden changes in any metric deserve investigation
- Compare periods strategically: Use “Last full week” for consistent week-over-week comparisons
- Drill down when needed: If you see concerning trends, use other dashboard tabs (Evaluation, Feedback, Knowledge) to diagnose the cause
Interpreting Common Patterns
High Volume, Low Quality
- Many threads but low positive evaluation rate
- Action: Review agent instructions and knowledge base quality
Low Volume, High Thread to Ticket Rate
- Few conversations, with a high proportion linked to tickets
- Action: Review these conversations to understand why tickets were needed
High First Contact Resolution, High Messages per Thread
- Quick resolutions but verbose conversations
- Action: Consider if agent responses can be more concise
Related Features
- Tickets Analytics - Monitor ticket creation and conversion
- User Analytics Dashboard - Deep dive into user engagement
- Topics Analytics - Topic distribution and trends
- MCP Analytics - MCP tool server usage monitoring
- CX Score - Detailed quality scoring across five dimensions
- Thread Evaluator - Configure automated quality evaluation