> ## Documentation Index
> Fetch the complete documentation index at: https://ago.mintlify.site/llms.txt
> Use this file to discover all available pages before exploring further.
# User Analytics Dashboard
> Insights into user behavior, engagement, and platform adoption
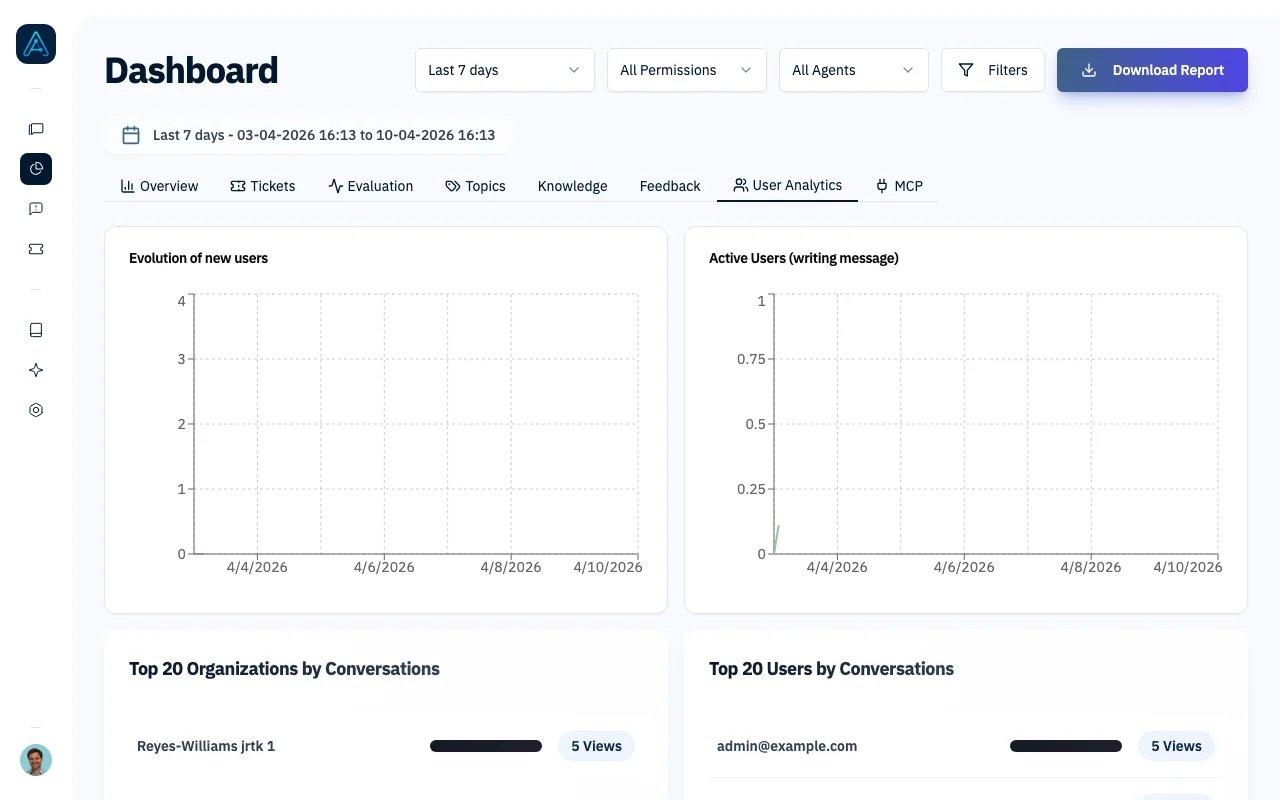
The User Analytics tab shows user registration trends, daily engagement, and activity breakdowns by organization and individual users.
 ## Accessing User Analytics
Navigate to **Dashboard** in the sidebar and select the **User Analytics** tab.
You need Admin or Account Manager permissions to access User Analytics.
## Dashboard Components
### New Users Over Time
A line chart tracking daily user registrations. Use it to spot growth trends and measure the impact of outreach campaigns.
### Active Users Over Time
A line chart showing how many users started at least one conversation each day.
A user is counted as "active" when they create a new conversation, not just when they log in.
### Top 20 Organizations by Thread Count
A stacked bar chart showing daily conversation activity for your most active organizations. Useful for identifying accounts that need more attention or support.
### Top 20 Users by Thread Count
A horizontal bar chart ranking users by total conversations over the selected period.
## Filtering Options
Use the dashboard header filters to refine your view:
| Filter | Description |
| ----------------------- | ---------------------------------------------------------------------------------------------------- |
| **Time Range** | Choose from: Last 24 hours, Last 7 days, Last 30 days, Last 90 days, Last full week, or Custom range |
| **Organization** | Filter to a specific organization |
| **Not In Organization** | Exclude a specific organization |
| **User Type** | Filter by user permission level |
| **Agent** | Filter by a specific agent |
## Access Control
| Role | Access Level |
| --------------- | ---------------------------------- |
| Administrator | Full access to all analytics |
| Account Manager | Filtered to assigned organizations |
| Standard User | No dashboard access |
Analytics data is also available via the [Public API v1 Reference](/api/public-api-v1).
## Troubleshooting
1. Verify the selected date range contains data
2. Check that users have been creating conversations (not just logging in)
3. Verify your account has admin privileges
1. Verify users are associated with organizations
2. Check organization configuration in admin settings
This is expected — account managers only see their assigned organizations. Contact an administrator for broader access.
## Related Features
* [Performance Dashboard](/features/performance-dashboard) - Overall agent metrics
* [Feedback Analytics](/features/feedback-analytics) - Satisfaction and feedback data
* [Knowledge Analytics](/features/knowledge-analytics) - Content usage tracking
## Accessing User Analytics
Navigate to **Dashboard** in the sidebar and select the **User Analytics** tab.
You need Admin or Account Manager permissions to access User Analytics.
## Dashboard Components
### New Users Over Time
A line chart tracking daily user registrations. Use it to spot growth trends and measure the impact of outreach campaigns.
### Active Users Over Time
A line chart showing how many users started at least one conversation each day.
A user is counted as "active" when they create a new conversation, not just when they log in.
### Top 20 Organizations by Thread Count
A stacked bar chart showing daily conversation activity for your most active organizations. Useful for identifying accounts that need more attention or support.
### Top 20 Users by Thread Count
A horizontal bar chart ranking users by total conversations over the selected period.
## Filtering Options
Use the dashboard header filters to refine your view:
| Filter | Description |
| ----------------------- | ---------------------------------------------------------------------------------------------------- |
| **Time Range** | Choose from: Last 24 hours, Last 7 days, Last 30 days, Last 90 days, Last full week, or Custom range |
| **Organization** | Filter to a specific organization |
| **Not In Organization** | Exclude a specific organization |
| **User Type** | Filter by user permission level |
| **Agent** | Filter by a specific agent |
## Access Control
| Role | Access Level |
| --------------- | ---------------------------------- |
| Administrator | Full access to all analytics |
| Account Manager | Filtered to assigned organizations |
| Standard User | No dashboard access |
Analytics data is also available via the [Public API v1 Reference](/api/public-api-v1).
## Troubleshooting
1. Verify the selected date range contains data
2. Check that users have been creating conversations (not just logging in)
3. Verify your account has admin privileges
1. Verify users are associated with organizations
2. Check organization configuration in admin settings
This is expected — account managers only see their assigned organizations. Contact an administrator for broader access.
## Related Features
* [Performance Dashboard](/features/performance-dashboard) - Overall agent metrics
* [Feedback Analytics](/features/feedback-analytics) - Satisfaction and feedback data
* [Knowledge Analytics](/features/knowledge-analytics) - Content usage tracking