> ## Documentation Index
> Fetch the complete documentation index at: https://ago.mintlify.site/llms.txt
> Use this file to discover all available pages before exploring further.
# Performance Dashboard
> Monitor your AI agent's overall performance with key metrics, volume trends, and distribution analytics
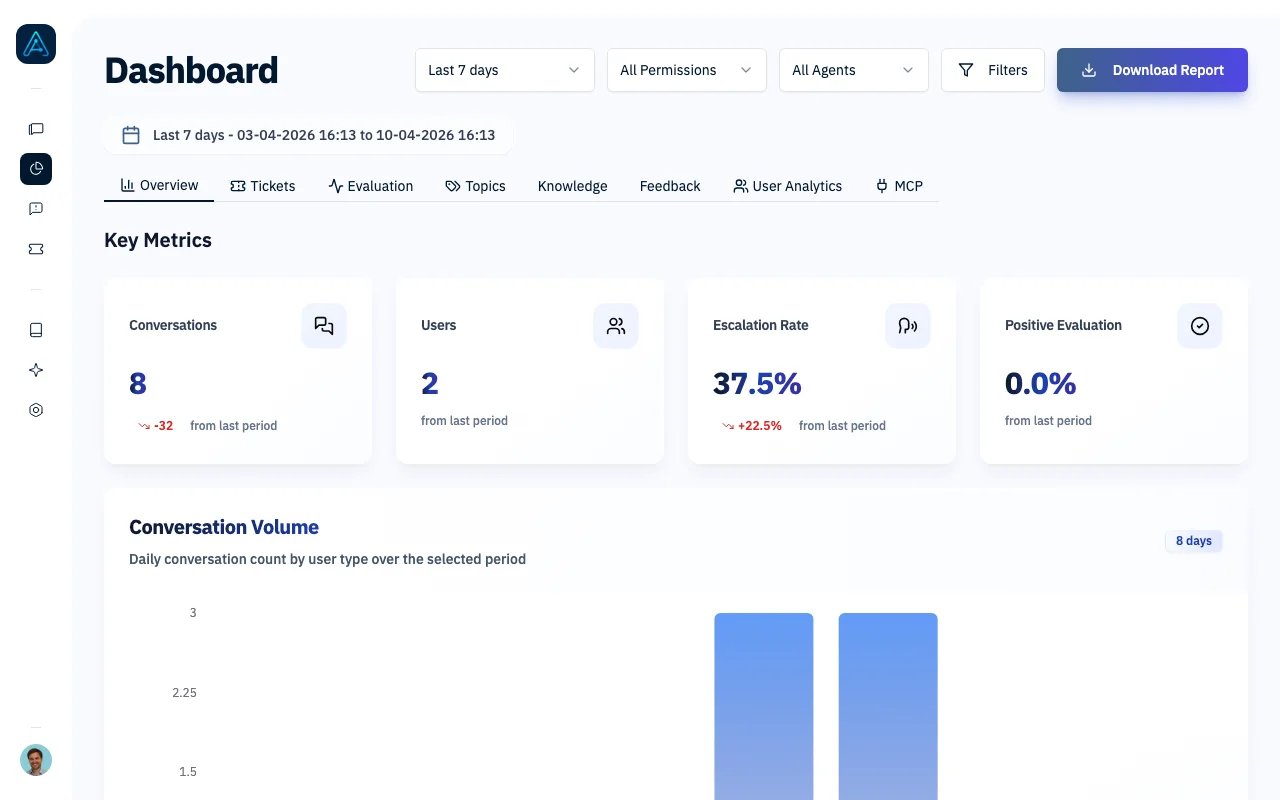
The Performance Dashboard provides a central view of your AI agent's operational metrics. The **Overview** tab (shown by default) tracks conversation volume, user engagement, and quality indicators at a glance.
The Dashboard has eight tabs, each focused on a different area:
| Tab | What It Shows |
| ------------------ | ------------------------------------------------------------------------------------------ |
| **Overview** | Key metrics, volume trends, distribution charts (this page) |
| **Evaluation** | CX Score distribution, dimension averages, satisfaction data |
| **Knowledge** | [Top documents, sources, and tags used in responses](/features/knowledge-analytics) |
| **Feedback** | [Feedback types, distribution, and recent submissions](/features/feedback-analytics) |
| **Tickets** | [Ticket volume, conversion rates, and top requesters](/features/tickets-analytics) |
| **Topics** | [Topic distribution treemap, trends, and per-agent breakdown](/features/topics-analytics) |
| **User Analytics** | [Registration trends, active users, top organizations](/features/user-analytics-dashboard) |
| **MCP** | [MCP call volume, errors, methods, and tool usage](/features/mcp-analytics) |
 ## Accessing the Performance Dashboard
Navigate to **Dashboard** in the sidebar. The **Overview** tab is displayed by default.
You need Admin or Account Manager permissions to access the Performance Dashboard.
## Key Performance Metrics
The dashboard displays four primary metrics at the top, each showing the current value and change from the previous period:
| Metric | Description | Positive Trend |
| ---------------------------- | ------------------------------------------------------------ | --------------------------- |
| **Number of Threads** | Total conversations during the period | Higher = more engagement |
| **Number of Users** | Unique users who started conversations | Higher = broader reach |
| **Escalation Rate** | Percentage of conversations where users requested human help | Lower = better self-service |
| **Positive Evaluation Rate** | Combined percentage of positive human and LLM evaluations | Higher = better quality |
Use period comparison (shown as +/- percentages) to identify trends. A sudden change may indicate an issue or improvement worth investigating.
## Dashboard Components
### Conversation Volume Chart
A bar chart showing the daily number of conversations over the selected time period. Use this to:
* Identify peak usage days
* Spot unusual spikes or drops in activity
* Understand weekly patterns
### Distribution Charts
#### Distribution by User Type
A pie chart showing conversations broken down by user permission level. This helps you understand:
* Which user segments engage most with the agent
* Whether certain user types have different usage patterns
* How to prioritize improvements for specific audiences
#### Distribution by Agent
A pie chart showing how conversations are distributed across your agents (if you have multiple). This reveals:
* Which agents handle the most traffic
* Load balancing across agents
* Opportunities to redirect traffic
The agent distribution chart only appears if you have multiple agents configured. If a conversation involves multiple agents, it may be counted for each.
## Advanced Metrics
Below the main charts, the dashboard shows three additional metrics:
| Metric | Description |
| --------------------------------- | ------------------------------------------------------------------- |
| **Returning Users** | Users who had conversations in both the current and previous period |
| **Avg Messages per Thread** | Average number of messages exchanged per conversation |
| **First Contact Resolution Rate** | Percentage of conversations resolved in a single exchange |
### Understanding Advanced Metrics
**Returning Users** indicates user loyalty and ongoing engagement. A high number suggests:
* Users find value in the agent
* Good user retention
* Opportunity to track satisfaction over time
**Average Messages per Thread** reveals conversation complexity:
* Lower values (1-3): Quick, efficient resolutions
* Higher values (5+): Complex issues or potential agent struggles
* Sudden increases may indicate problems with response quality
**First Contact Resolution Rate** measures efficiency:
* Higher rates mean users get answers quickly
* Lower rates may indicate complex topics or knowledge gaps
* Compare against escalation rate for a complete picture
## Filtering Options
Use the dashboard header filters to customize your view:
| Filter | Description |
| ---------------- | ---------------------------------------------------------------------------------------------------- |
| **Time Range** | Choose from: Last 24 hours, Last 7 days, Last 30 days, Last 90 days, Last full week, or Custom range |
| **Organization** | Filter to conversations from a specific organization |
| **User Type** | Filter by user permission level |
| **Agent** | Filter by a specific agent |
## Period Comparison
All metrics include period-over-period comparison:
* **Last 7 days** compares to the 7 days before
* **Last 30 days** compares to the 30 days before
* **Custom range** compares to an equal period immediately prior
Changes are displayed as:
* Green with arrow up: Positive trend (or negative for metrics where lower is better)
* Red with arrow down: Negative trend
* Gray: No significant change
## Exporting Reports
### PDF Export
Click the PDF export button in the dashboard header to generate a detailed report including:
* All key metrics with period comparison
* Volume chart visualization
* Distribution charts
* Advanced metrics
The PDF includes the date range and filters applied, making it suitable for sharing or archiving.
## Best Practices
1. **Check daily**: A quick look at the Overview tab helps catch issues early
2. **Monitor escalation rate**: Rising escalation rates often indicate knowledge base gaps or agent instruction problems
3. **Track returning users**: A growing base of returning users indicates the agent provides ongoing value
4. **Investigate anomalies**: Sudden changes in any metric deserve investigation
5. **Compare periods strategically**: Use "Last full week" for consistent week-over-week comparisons
6. **Drill down when needed**: If you see concerning trends, use other dashboard tabs (Evaluation, Feedback, Knowledge) to diagnose the cause
## Interpreting Common Patterns
### High Volume, Low Quality
* Many threads but low positive evaluation rate
* Action: Review agent instructions and knowledge base quality
### Low Volume, High Escalation
* Few conversations but many escalations
* Action: Check if users are finding the agent or if they're immediately escalating
### High First Contact Resolution, High Messages per Thread
* Quick resolutions but verbose conversations
* Action: Consider if agent responses can be more concise
### Declining Returning Users
* Fewer users coming back
* Action: Analyze feedback and evaluate whether the agent is meeting user needs
## Related Features
* [Tickets Analytics](/features/tickets-analytics) - Monitor ticket creation and conversion
* [User Analytics Dashboard](/features/user-analytics-dashboard) - Deep dive into user engagement
* [Topics Analytics](/features/topics-analytics) - Topic distribution and trends
* [MCP Analytics](/features/mcp-analytics) - MCP tool server usage monitoring
* [CX Score](/features/cx-score) - Detailed quality scoring across five dimensions
* [Thread Evaluator](/features/thread-evaluator) - Configure automated quality evaluation
## Accessing the Performance Dashboard
Navigate to **Dashboard** in the sidebar. The **Overview** tab is displayed by default.
You need Admin or Account Manager permissions to access the Performance Dashboard.
## Key Performance Metrics
The dashboard displays four primary metrics at the top, each showing the current value and change from the previous period:
| Metric | Description | Positive Trend |
| ---------------------------- | ------------------------------------------------------------ | --------------------------- |
| **Number of Threads** | Total conversations during the period | Higher = more engagement |
| **Number of Users** | Unique users who started conversations | Higher = broader reach |
| **Escalation Rate** | Percentage of conversations where users requested human help | Lower = better self-service |
| **Positive Evaluation Rate** | Combined percentage of positive human and LLM evaluations | Higher = better quality |
Use period comparison (shown as +/- percentages) to identify trends. A sudden change may indicate an issue or improvement worth investigating.
## Dashboard Components
### Conversation Volume Chart
A bar chart showing the daily number of conversations over the selected time period. Use this to:
* Identify peak usage days
* Spot unusual spikes or drops in activity
* Understand weekly patterns
### Distribution Charts
#### Distribution by User Type
A pie chart showing conversations broken down by user permission level. This helps you understand:
* Which user segments engage most with the agent
* Whether certain user types have different usage patterns
* How to prioritize improvements for specific audiences
#### Distribution by Agent
A pie chart showing how conversations are distributed across your agents (if you have multiple). This reveals:
* Which agents handle the most traffic
* Load balancing across agents
* Opportunities to redirect traffic
The agent distribution chart only appears if you have multiple agents configured. If a conversation involves multiple agents, it may be counted for each.
## Advanced Metrics
Below the main charts, the dashboard shows three additional metrics:
| Metric | Description |
| --------------------------------- | ------------------------------------------------------------------- |
| **Returning Users** | Users who had conversations in both the current and previous period |
| **Avg Messages per Thread** | Average number of messages exchanged per conversation |
| **First Contact Resolution Rate** | Percentage of conversations resolved in a single exchange |
### Understanding Advanced Metrics
**Returning Users** indicates user loyalty and ongoing engagement. A high number suggests:
* Users find value in the agent
* Good user retention
* Opportunity to track satisfaction over time
**Average Messages per Thread** reveals conversation complexity:
* Lower values (1-3): Quick, efficient resolutions
* Higher values (5+): Complex issues or potential agent struggles
* Sudden increases may indicate problems with response quality
**First Contact Resolution Rate** measures efficiency:
* Higher rates mean users get answers quickly
* Lower rates may indicate complex topics or knowledge gaps
* Compare against escalation rate for a complete picture
## Filtering Options
Use the dashboard header filters to customize your view:
| Filter | Description |
| ---------------- | ---------------------------------------------------------------------------------------------------- |
| **Time Range** | Choose from: Last 24 hours, Last 7 days, Last 30 days, Last 90 days, Last full week, or Custom range |
| **Organization** | Filter to conversations from a specific organization |
| **User Type** | Filter by user permission level |
| **Agent** | Filter by a specific agent |
## Period Comparison
All metrics include period-over-period comparison:
* **Last 7 days** compares to the 7 days before
* **Last 30 days** compares to the 30 days before
* **Custom range** compares to an equal period immediately prior
Changes are displayed as:
* Green with arrow up: Positive trend (or negative for metrics where lower is better)
* Red with arrow down: Negative trend
* Gray: No significant change
## Exporting Reports
### PDF Export
Click the PDF export button in the dashboard header to generate a detailed report including:
* All key metrics with period comparison
* Volume chart visualization
* Distribution charts
* Advanced metrics
The PDF includes the date range and filters applied, making it suitable for sharing or archiving.
## Best Practices
1. **Check daily**: A quick look at the Overview tab helps catch issues early
2. **Monitor escalation rate**: Rising escalation rates often indicate knowledge base gaps or agent instruction problems
3. **Track returning users**: A growing base of returning users indicates the agent provides ongoing value
4. **Investigate anomalies**: Sudden changes in any metric deserve investigation
5. **Compare periods strategically**: Use "Last full week" for consistent week-over-week comparisons
6. **Drill down when needed**: If you see concerning trends, use other dashboard tabs (Evaluation, Feedback, Knowledge) to diagnose the cause
## Interpreting Common Patterns
### High Volume, Low Quality
* Many threads but low positive evaluation rate
* Action: Review agent instructions and knowledge base quality
### Low Volume, High Escalation
* Few conversations but many escalations
* Action: Check if users are finding the agent or if they're immediately escalating
### High First Contact Resolution, High Messages per Thread
* Quick resolutions but verbose conversations
* Action: Consider if agent responses can be more concise
### Declining Returning Users
* Fewer users coming back
* Action: Analyze feedback and evaluate whether the agent is meeting user needs
## Related Features
* [Tickets Analytics](/features/tickets-analytics) - Monitor ticket creation and conversion
* [User Analytics Dashboard](/features/user-analytics-dashboard) - Deep dive into user engagement
* [Topics Analytics](/features/topics-analytics) - Topic distribution and trends
* [MCP Analytics](/features/mcp-analytics) - MCP tool server usage monitoring
* [CX Score](/features/cx-score) - Detailed quality scoring across five dimensions
* [Thread Evaluator](/features/thread-evaluator) - Configure automated quality evaluation