> ## Documentation Index
> Fetch the complete documentation index at: https://ago.mintlify.site/llms.txt
> Use this file to discover all available pages before exploring further.
# Knowledge Analytics
> Track how your knowledge base content is being used to improve documentation coverage and relevance
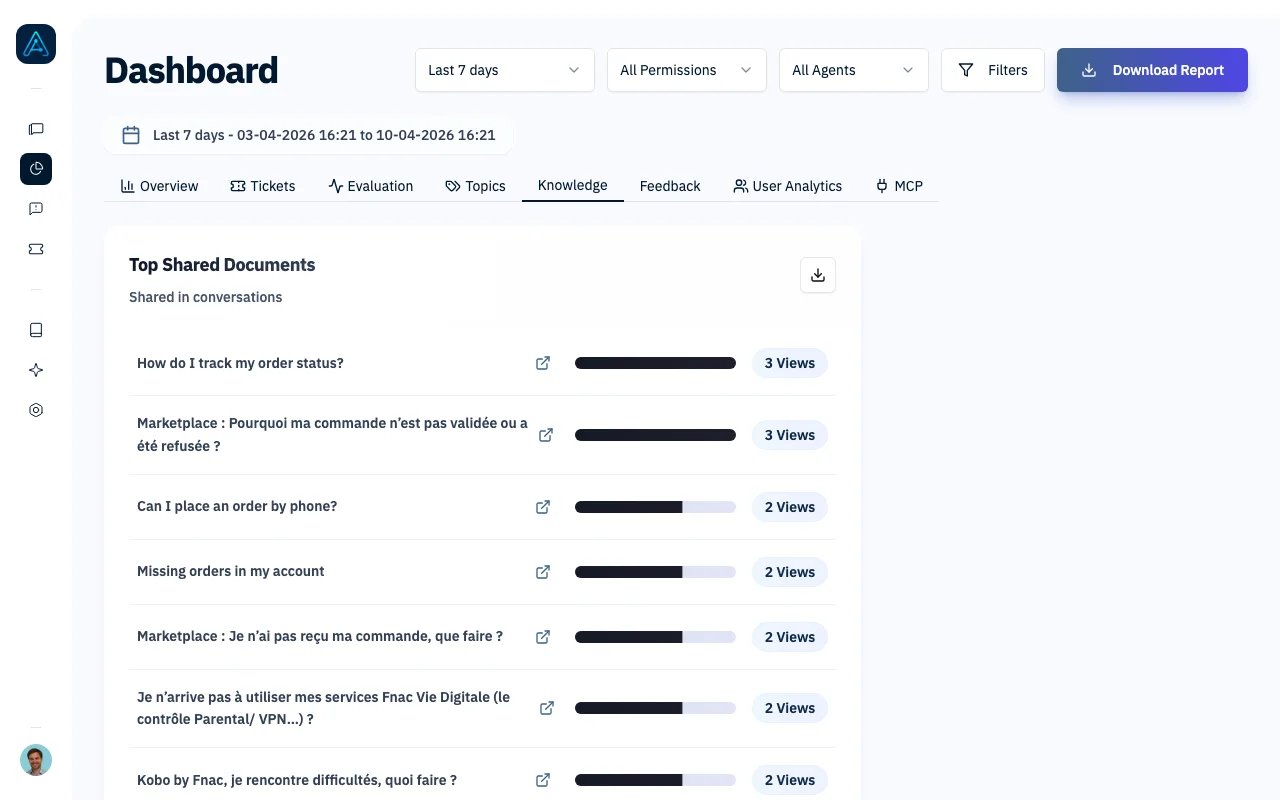
The Knowledge Analytics dashboard shows which documents, sources, and tags are being used most frequently in agent responses, helping you understand content effectiveness and identify gaps.
 ## Accessing Knowledge Analytics
Navigate to **Dashboard** in the sidebar and select the **Knowledge** tab.
You need Admin or Account Manager permissions to access Knowledge Analytics.
## Dashboard Components
The Knowledge tab displays four key lists showing your most-used content:
### Top Shared Documents
Shows documents most frequently included in agent responses (retrieved by the AI during conversations).
| Column | Description |
| ----------------- | ------------------------------------------ |
| **Document Name** | The title of the document |
| **Count** | Number of times the document was retrieved |
| **Link** | Click to view the document |
Documents that appear frequently are your most valuable content. Verify they are accurate and up-to-date.
### Top Viewed Documents
Shows documents that users clicked on to view after the agent shared them.
| Column | Description |
| ----------------- | ------------------------------------- |
| **Document Name** | The title of the document |
| **View Count** | Number of times users clicked to view |
| **Link** | Click to view the document |
The difference between shared and viewed documents can reveal:
* **High shared, low viewed**: Documents may not be relevant to user needs, or the agent's response already answered the question
* **High viewed**: Documents that users find valuable enough to read in full
### Top Tags
Shows the most frequently used tags in retrieved documents.
| Column | Description |
| ------------ | ------------------------------------------------------ |
| **Tag Name** | The tag label |
| **Count** | Number of times documents with this tag were retrieved |
Tags help you understand:
* Which topics users ask about most
* Whether your tagging strategy aligns with user needs
* Opportunities to expand content for popular tags
### Top Shared Sources
Shows the knowledge sources (integrations like Notion, Confluence, or uploaded files) that contribute most to agent responses.
| Column | Description |
| --------------- | --------------------------------------------------------- |
| **Source Name** | The name of the knowledge source |
| **Count** | Number of times documents from this source were retrieved |
Use this to:
* Identify your most valuable knowledge sources
* Prioritize which sources to keep updated
* Evaluate ROI of different content platforms
## Filtering Options
Use the dashboard header filters to refine your analysis:
| Filter | Description |
| ---------------- | -------------------------------------------------- |
| **Time Range** | Select predefined ranges or custom dates |
| **Organization** | Filter to content used for a specific organization |
| **User Type** | Filter by user permission level |
| **Agent** | Filter by which agent retrieved the content |
## Exporting Data
Each list card includes a download button to export the full data as CSV. This allows you to:
* Analyze longer lists beyond the top displayed items
* Import data into spreadsheets for custom analysis
* Track changes over time by comparing exports
### Available Exports
| Export Type | Description |
| -------------------- | ----------------------------------------------- |
| **Documents** | Full list of shared documents with counts |
| **Viewed Documents** | Full list of clicked documents with view counts |
| **Sources** | Full list of sources with usage counts |
| **Tags** | Full list of tags with usage counts |
## Interpreting the Data
### Identifying Content Gaps
If certain topics have high user demand but low document retrieval:
1. Check if relevant documentation exists
2. Review if documents are properly tagged
3. Consider creating new content for the topic
### Measuring Content ROI
Compare content creation effort against usage:
* Documents created recently that appear in top lists are high-value additions
* Documents never appearing may need better tagging or reconsideration
### Improving Knowledge Sources
If one source dominates the top shared list:
* Consider whether other sources are properly synced
* Evaluate if other sources need better organization
* Check that sync schedules are running correctly
### Understanding User Behavior
The gap between "shared" and "viewed" documents reveals:
* **Users clicking frequently**: May need more detailed documents or better agent summaries
* **Users rarely clicking**: Agent responses may be sufficiently thorough
## Best Practices
1. **Review weekly**: Regular monitoring helps identify trending topics and content gaps
2. **Cross-reference with feedback**: If a frequently-used document has associated negative feedback, prioritize reviewing it
3. **Update popular content first**: Documents appearing in top lists should be your priority for updates and accuracy checks
4. **Balance coverage**: If certain tags dominate, consider expanding documentation for underrepresented topics
5. **Track source health**: Verify all knowledge sources are syncing properly and contributing to responses
## Related Features
* [Performance Dashboard](/features/performance-dashboard) - Overall agent metrics and volume trends
* [User Analytics Dashboard](/features/user-analytics-dashboard) - Track user engagement patterns
* [Feedback Analytics](/features/feedback-analytics) - Analyze user feedback trends
* [Knowledge Overview](/features/knowledge-overview) - Manage your knowledge sources
## Accessing Knowledge Analytics
Navigate to **Dashboard** in the sidebar and select the **Knowledge** tab.
You need Admin or Account Manager permissions to access Knowledge Analytics.
## Dashboard Components
The Knowledge tab displays four key lists showing your most-used content:
### Top Shared Documents
Shows documents most frequently included in agent responses (retrieved by the AI during conversations).
| Column | Description |
| ----------------- | ------------------------------------------ |
| **Document Name** | The title of the document |
| **Count** | Number of times the document was retrieved |
| **Link** | Click to view the document |
Documents that appear frequently are your most valuable content. Verify they are accurate and up-to-date.
### Top Viewed Documents
Shows documents that users clicked on to view after the agent shared them.
| Column | Description |
| ----------------- | ------------------------------------- |
| **Document Name** | The title of the document |
| **View Count** | Number of times users clicked to view |
| **Link** | Click to view the document |
The difference between shared and viewed documents can reveal:
* **High shared, low viewed**: Documents may not be relevant to user needs, or the agent's response already answered the question
* **High viewed**: Documents that users find valuable enough to read in full
### Top Tags
Shows the most frequently used tags in retrieved documents.
| Column | Description |
| ------------ | ------------------------------------------------------ |
| **Tag Name** | The tag label |
| **Count** | Number of times documents with this tag were retrieved |
Tags help you understand:
* Which topics users ask about most
* Whether your tagging strategy aligns with user needs
* Opportunities to expand content for popular tags
### Top Shared Sources
Shows the knowledge sources (integrations like Notion, Confluence, or uploaded files) that contribute most to agent responses.
| Column | Description |
| --------------- | --------------------------------------------------------- |
| **Source Name** | The name of the knowledge source |
| **Count** | Number of times documents from this source were retrieved |
Use this to:
* Identify your most valuable knowledge sources
* Prioritize which sources to keep updated
* Evaluate ROI of different content platforms
## Filtering Options
Use the dashboard header filters to refine your analysis:
| Filter | Description |
| ---------------- | -------------------------------------------------- |
| **Time Range** | Select predefined ranges or custom dates |
| **Organization** | Filter to content used for a specific organization |
| **User Type** | Filter by user permission level |
| **Agent** | Filter by which agent retrieved the content |
## Exporting Data
Each list card includes a download button to export the full data as CSV. This allows you to:
* Analyze longer lists beyond the top displayed items
* Import data into spreadsheets for custom analysis
* Track changes over time by comparing exports
### Available Exports
| Export Type | Description |
| -------------------- | ----------------------------------------------- |
| **Documents** | Full list of shared documents with counts |
| **Viewed Documents** | Full list of clicked documents with view counts |
| **Sources** | Full list of sources with usage counts |
| **Tags** | Full list of tags with usage counts |
## Interpreting the Data
### Identifying Content Gaps
If certain topics have high user demand but low document retrieval:
1. Check if relevant documentation exists
2. Review if documents are properly tagged
3. Consider creating new content for the topic
### Measuring Content ROI
Compare content creation effort against usage:
* Documents created recently that appear in top lists are high-value additions
* Documents never appearing may need better tagging or reconsideration
### Improving Knowledge Sources
If one source dominates the top shared list:
* Consider whether other sources are properly synced
* Evaluate if other sources need better organization
* Check that sync schedules are running correctly
### Understanding User Behavior
The gap between "shared" and "viewed" documents reveals:
* **Users clicking frequently**: May need more detailed documents or better agent summaries
* **Users rarely clicking**: Agent responses may be sufficiently thorough
## Best Practices
1. **Review weekly**: Regular monitoring helps identify trending topics and content gaps
2. **Cross-reference with feedback**: If a frequently-used document has associated negative feedback, prioritize reviewing it
3. **Update popular content first**: Documents appearing in top lists should be your priority for updates and accuracy checks
4. **Balance coverage**: If certain tags dominate, consider expanding documentation for underrepresented topics
5. **Track source health**: Verify all knowledge sources are syncing properly and contributing to responses
## Related Features
* [Performance Dashboard](/features/performance-dashboard) - Overall agent metrics and volume trends
* [User Analytics Dashboard](/features/user-analytics-dashboard) - Track user engagement patterns
* [Feedback Analytics](/features/feedback-analytics) - Analyze user feedback trends
* [Knowledge Overview](/features/knowledge-overview) - Manage your knowledge sources