> ## Documentation Index
> Fetch the complete documentation index at: https://ago.mintlify.site/llms.txt
> Use this file to discover all available pages before exploring further.
# Evaluation Dashboard
> Review conversation quality metrics including human evaluations, LLM evaluations, CX Score, and satisfaction data
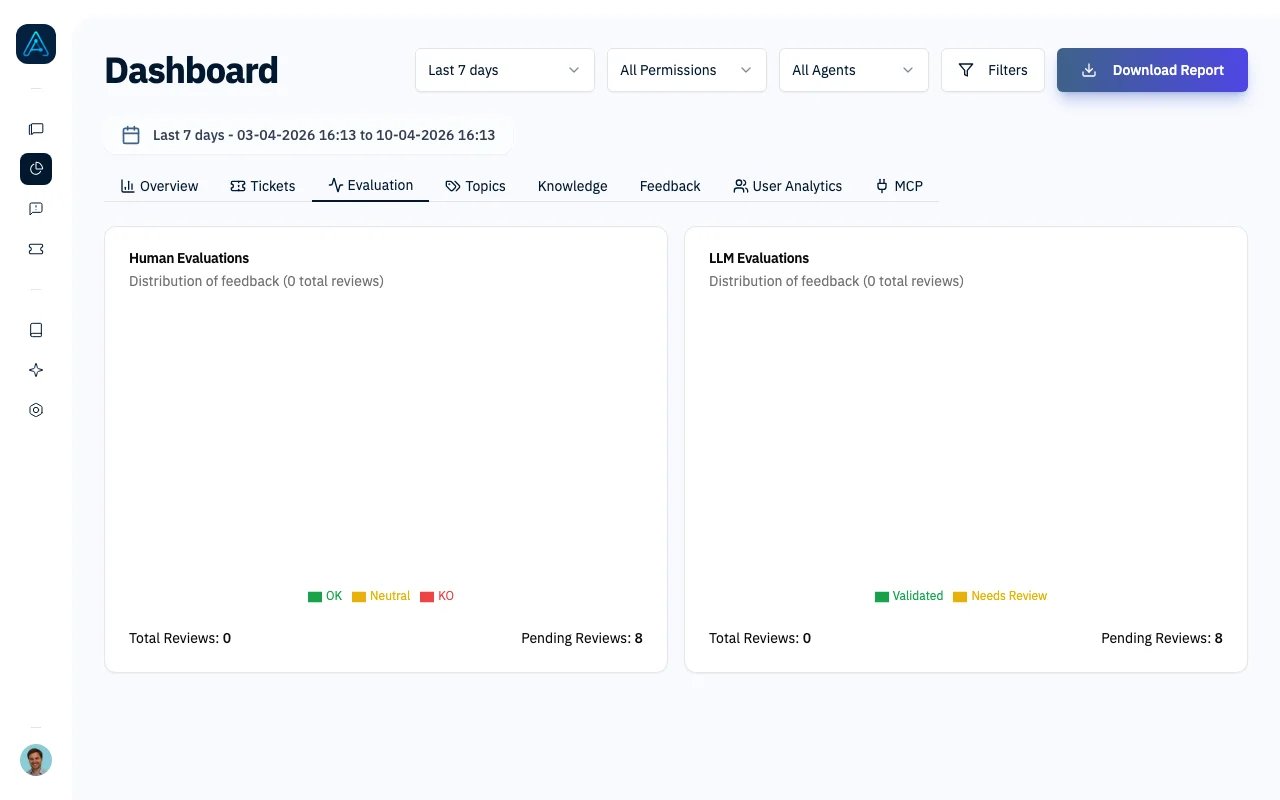 The Evaluation tab on the Dashboard brings together all conversation quality data: human review results, LLM evaluation results, CX Score analytics, and satisfaction feedback. Use it to assess overall quality and spot areas that need attention.
## Accessing the Evaluation Dashboard
Navigate to **Dashboard** in the sidebar and select the **Evaluation** tab.
You need Admin or Account Manager permissions to access the Evaluation Dashboard.
## Dashboard Sections
The Evaluation tab displays up to six sections, depending on your configuration.
### Human Evaluations
A pie chart showing the distribution of manual evaluations (OK, KO, Neutral, Not Evaluated). These are the ratings that admins assign when reviewing conversations in the [Conversation Management](/features/conversation-management) sidebar.
### LLM Evaluations
A pie chart showing the distribution of automated evaluations (Validated, Needs Review). The [Thread Evaluator](/features/thread-evaluator) generates these ratings based on dimension scores and minimum thresholds.
### CX Score
Appears when the Thread Evaluator is enabled and has scored at least one conversation. Includes:
| Component | What It Shows |
| ---------------------- | ---------------------------------------------------------------------------------------------------------------------------------- |
| **Score Gauge** | Overall average CX Score (0-100) for the selected period |
| **Dimension Averages** | Progress bars for each of the five dimensions (Resolution Quality, Response Accuracy, Tone & Empathy, Efficiency, Customer Effort) |
| **Score Distribution** | Bar chart breaking conversations into Poor (0-49), Needs Improvement (50-79), and Good (80-100) |
Click a score range in the distribution chart to jump to [Chat History](/features/conversations-list) filtered to those conversations.
See [CX Score](/features/cx-score) for details on how the score is calculated and how to interpret each dimension.
### CX Score Trend
A line chart showing the daily average CX Score over the selected period. Use this to:
* Confirm that changes to agent instructions or knowledge base improve quality
* Spot dips that may correlate with knowledge base updates or new topics
### CX Score by Agent
A bar chart comparing average CX Score across agents. Helps you identify which agents need attention and which can serve as models for others.
### Satisfaction
Appears when satisfaction feedback is enabled on at least one agent and users have submitted responses. Includes:
| Component | What It Shows |
| ---------------------- | ---------------------------------------------------------- |
| **Total Requests** | Number of satisfaction prompts sent to users |
| **Response Rate** | Percentage of users who responded |
| **Satisfaction Rate** | Percentage of positive responses among those who responded |
| **Distribution Chart** | Pie chart of satisfied / neutral / not satisfied |
| **Daily Trend** | Area chart showing daily response breakdown over time |
Satisfaction feedback is configured per agent. If no agents have it enabled, this section does not appear.
## Filtering Options
The Evaluation tab shares the same header filters as other dashboard tabs:
| Filter | Description |
| ---------------- | -------------------------------------------------------- |
| **Time Range** | Choose from predefined ranges or set a custom date range |
| **Organization** | Filter to a specific organization |
| **User Type** | Filter by user permission level |
| **Agent** | Filter by a specific agent |
## PDF Export
Click the PDF export button in the dashboard header to generate a report of the current Evaluation tab view, including all visible charts and metrics.
## Related Features
* [CX Score](/features/cx-score) - Scoring methodology and dimension details
* [Thread Evaluator](/features/thread-evaluator) - Configure automated evaluation
* [Conversation Management](/features/conversation-management) - Manually evaluate conversations
* [Performance Dashboard](/features/performance-dashboard) - Overview of all dashboard tabs
* [Diagnose Quality Issues](/guides/diagnose-quality-issues) - Investigate low CX Scores step by step
The Evaluation tab on the Dashboard brings together all conversation quality data: human review results, LLM evaluation results, CX Score analytics, and satisfaction feedback. Use it to assess overall quality and spot areas that need attention.
## Accessing the Evaluation Dashboard
Navigate to **Dashboard** in the sidebar and select the **Evaluation** tab.
You need Admin or Account Manager permissions to access the Evaluation Dashboard.
## Dashboard Sections
The Evaluation tab displays up to six sections, depending on your configuration.
### Human Evaluations
A pie chart showing the distribution of manual evaluations (OK, KO, Neutral, Not Evaluated). These are the ratings that admins assign when reviewing conversations in the [Conversation Management](/features/conversation-management) sidebar.
### LLM Evaluations
A pie chart showing the distribution of automated evaluations (Validated, Needs Review). The [Thread Evaluator](/features/thread-evaluator) generates these ratings based on dimension scores and minimum thresholds.
### CX Score
Appears when the Thread Evaluator is enabled and has scored at least one conversation. Includes:
| Component | What It Shows |
| ---------------------- | ---------------------------------------------------------------------------------------------------------------------------------- |
| **Score Gauge** | Overall average CX Score (0-100) for the selected period |
| **Dimension Averages** | Progress bars for each of the five dimensions (Resolution Quality, Response Accuracy, Tone & Empathy, Efficiency, Customer Effort) |
| **Score Distribution** | Bar chart breaking conversations into Poor (0-49), Needs Improvement (50-79), and Good (80-100) |
Click a score range in the distribution chart to jump to [Chat History](/features/conversations-list) filtered to those conversations.
See [CX Score](/features/cx-score) for details on how the score is calculated and how to interpret each dimension.
### CX Score Trend
A line chart showing the daily average CX Score over the selected period. Use this to:
* Confirm that changes to agent instructions or knowledge base improve quality
* Spot dips that may correlate with knowledge base updates or new topics
### CX Score by Agent
A bar chart comparing average CX Score across agents. Helps you identify which agents need attention and which can serve as models for others.
### Satisfaction
Appears when satisfaction feedback is enabled on at least one agent and users have submitted responses. Includes:
| Component | What It Shows |
| ---------------------- | ---------------------------------------------------------- |
| **Total Requests** | Number of satisfaction prompts sent to users |
| **Response Rate** | Percentage of users who responded |
| **Satisfaction Rate** | Percentage of positive responses among those who responded |
| **Distribution Chart** | Pie chart of satisfied / neutral / not satisfied |
| **Daily Trend** | Area chart showing daily response breakdown over time |
Satisfaction feedback is configured per agent. If no agents have it enabled, this section does not appear.
## Filtering Options
The Evaluation tab shares the same header filters as other dashboard tabs:
| Filter | Description |
| ---------------- | -------------------------------------------------------- |
| **Time Range** | Choose from predefined ranges or set a custom date range |
| **Organization** | Filter to a specific organization |
| **User Type** | Filter by user permission level |
| **Agent** | Filter by a specific agent |
## PDF Export
Click the PDF export button in the dashboard header to generate a report of the current Evaluation tab view, including all visible charts and metrics.
## Related Features
* [CX Score](/features/cx-score) - Scoring methodology and dimension details
* [Thread Evaluator](/features/thread-evaluator) - Configure automated evaluation
* [Conversation Management](/features/conversation-management) - Manually evaluate conversations
* [Performance Dashboard](/features/performance-dashboard) - Overview of all dashboard tabs
* [Diagnose Quality Issues](/guides/diagnose-quality-issues) - Investigate low CX Scores step by step